“When will it be over?”: An introduction to viral reproduction numbers, R0 and Re
April 14, 2020

Jeffrey K Aronson, Jon Brassey, Kamal R Mahtani
On behalf of the Oxford COVID-19 Evidence Service Team
Centre for Evidence-Based Medicine, Nuffield Department of Primary Care Health Sciences
University of Oxford
Correspondence to jeffrey.aronson@phc.ox.ac.uk
PDF to Download
The UK Government is regularly reviewing the current lockdown measures, as it is required to do every 3 weeks, by law. With the peak of the pandemic yet to arrive in the UK, it seems certain that the current measures will continue. So when will the UK lockdown end?
On 30 March 2020, Sir Patrick Vallance, the Government’s Chief Scientific Officer, gave an indication of how this decision may be guided, saying that Britain’s lockdown was having a “very big effect” on the R0, bringing it down “below one”.
The figure to which he was referring is the basic reproduction number (or reproductive ratio) of a virus, called R0 (R nought or R zero). And it is important to know how to interpret it.
We include some definitions in the box at the end.
The basic reproduction number
The basic reproduction number is defined as the number of cases that are expected to occur on average in a homogeneous population as a result of infection by a single individual, when the population is susceptible at the start of an epidemic, before widespread immunity starts to develop and before any attempt has been made at immunization. So if one person develops the infection and passes it on to two others, the R0 is 2.
If the average R0 in the population is greater than 1, the infection will spread exponentially. If R0 is less than 1, the infection will spread only slowly, and it will eventually die out. The higher the value of R0, the faster an epidemic will progress.
R0 is estimated from data collected in the field and entered into mathematical models. The estimated value depends on the model used and the data that inform it.
R0 is affected by:
- the proportion of susceptible people at the start and the density of the population;
- the infectiousness of the organism;
- the rate of disappearance of cases by recovery or death, the first of which depends on the time for which an individual is infective;
The denser the population, the more people are susceptible, and the more infective the virus, the larger R0 will be for a given virus; the faster the rate of removal of infected individuals, by recovery or death, the smaller R0 will be.
The zero in “R zero” means that it is estimated when there is zero immunity in the population, even though not everyone will necessarily be susceptible to infection, although that is the usual assumption. In an epidemic with a completely new virus, the earlier the measurements are made the nearer the calculated value is likely to be to the true value of R0, assuming high-quality data. For this reason, it is better to talk about the transmissibility of the virus at the time that it is measured, using a different symbol, Re, the effective reproduction number.
The effective reproduction number, Re
The effective reproduction number, Re, sometimes also called Rt, is the number of people in a population who can be infected by an individual at any specific time. It changes as the population becomes increasingly immunized, either by individual immunity following infection or by vaccination, and also as people die.
Re is affected by the number of people with the infection and the number of susceptibles with whom infected people are in contact. People’s behaviour (e.g. social distancing) can also affect Re.
The number of susceptibles falls as people die or become immunized by exposure. The sooner people recover or die, the smaller the value of Re will be at any given time.
Unfortunately, the symbol R0 is often used in publications when Re is meant. This can be confusing.
Herd immunity
Initial reports suggested that one of the UK Government’s strategies in tackling the pandemic was to allow the virus to spread within the community, in a controlled way, so that immunity, so-called herd immunity, could develop across the population. However, the health secretary, Matt Hancock, later said that this was not part of the UK response to the virus. In contrast, other countries, such as Sweden, have responded to the pandemic in ways that avoid full lockdown. The problem with leaving people to catch the infection spontaneously, leading to herd immunity, is that the death rate would increase as a result. For example, on 10 April, the number of confirmed cases in Sweden was 9685 with 870 deaths (9.0%), compared with Norway with 6219 confirmed cases and 108 deaths (1.7%) and Denmark with 5830 confirmed cases and 237 deaths (4.4%).
R0 predicts the extent of immunization that a population requires if herd immunity is to be achieved, the spread of the infection limited, and the population protected against future infection. To prevent sustained spread of the infection the proportion of the population that has to be immunized (Pi) has to be greater than 1 − 1/R0. The relation between Pi and 1 – 1/R0 is shown in Figure 1.
For example, if R0 = 2, immunization needs to be achieved in 50% of the population. However, if R0 = 5 the proportion rises steeply, to 80%. Beyond that the rise is less steep; an increase in R0 to 10 increases the need for immunization to 90%. Measles has an R0 greater than 10, which is why immunization of a large proportion of the population is so important in preventing the disease.
Thus, if R0 is 10, a child with measles will infect 10 others if they are susceptible. When other children become immune the infected child who encounters 10 children will not be able to infect them all; the number infected will depend on Re. When immunity is 90% or more the chances that the child will meet enough unimmunized children to pass on the disease falls to near zero, and the population is protected.
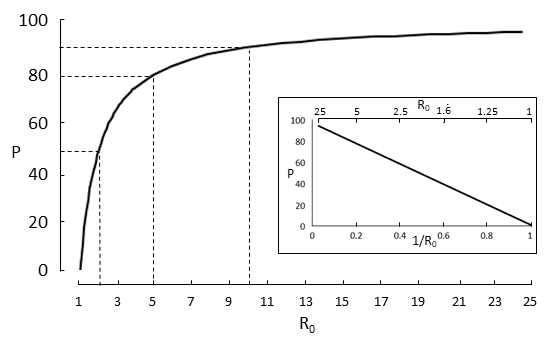
Figure 1. The relation between the basic reproduction number of a virus, R0, and the proportion of the population that needs to be immunized to achieve herd immunity; note the steep rise of the curve at values of R0 between 1 and 5; three examples are shown: R0 =2, proportion = 50%, R0 = 5, proportion = 80%; R0 = 10, proportion = 90%; the inset shows a linearization of the main graph, generated by plotting P against 1/R0
At any time, Re = R0 × (1 – Pi), where Pi is the proportion of the population who are immune at that time. This is illustrated in Figure 2.
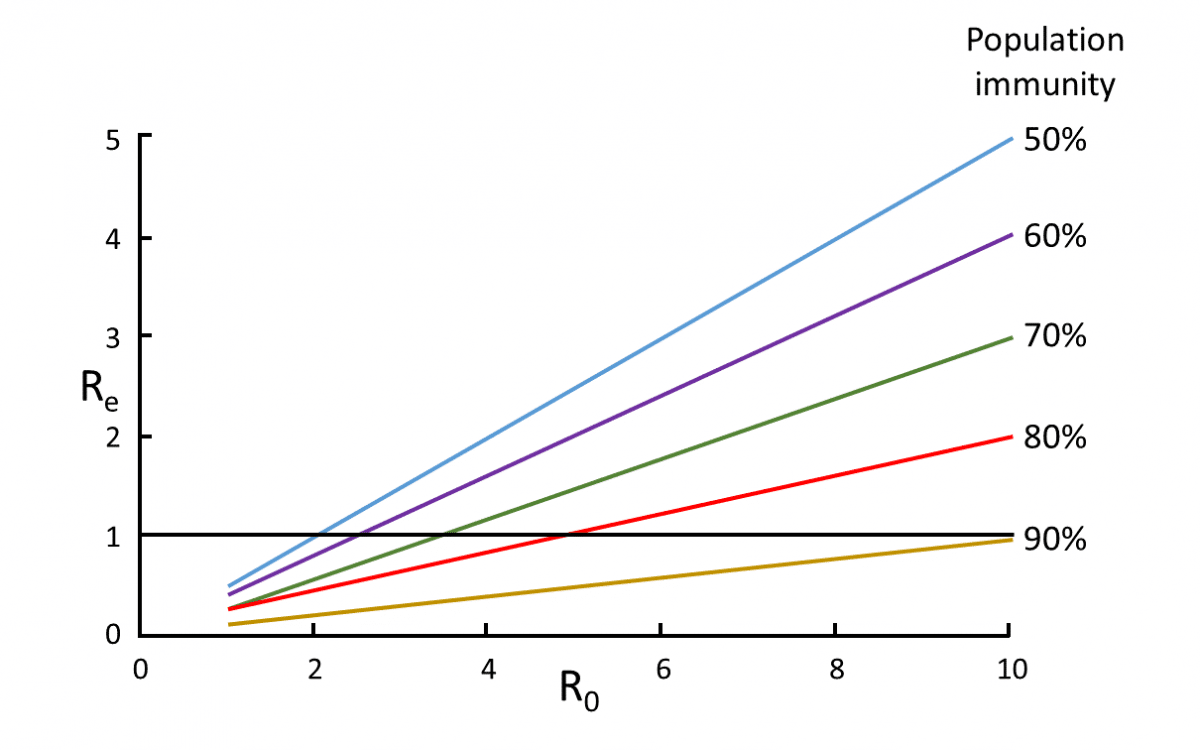
Figure 2. The relation between R0 and Re at different levels of population immunity
For example, immunization of 50% of the population (blue line) will bring Re down below one only if R0 was no greater than 2; in contrast immunization of 90% of the population (brown line) will bring Re down to 1 or less for all values of R0 up to 10.
How R0 is estimated
A typical epidemiological model by which R0 is estimated is based on three factors: individual Susceptibility to the infection, the rate at which infections actually occur (Infectivity), and the rate of Removal of infection from the population, by either recovery or death. This is the so-called S-I-R model.The model involves the solution of simultaneous linear differential equations and was described as long ago as 1927 by W. O. Kermack and A. G. McKendrick. A version of their model is shown in Figure 3.
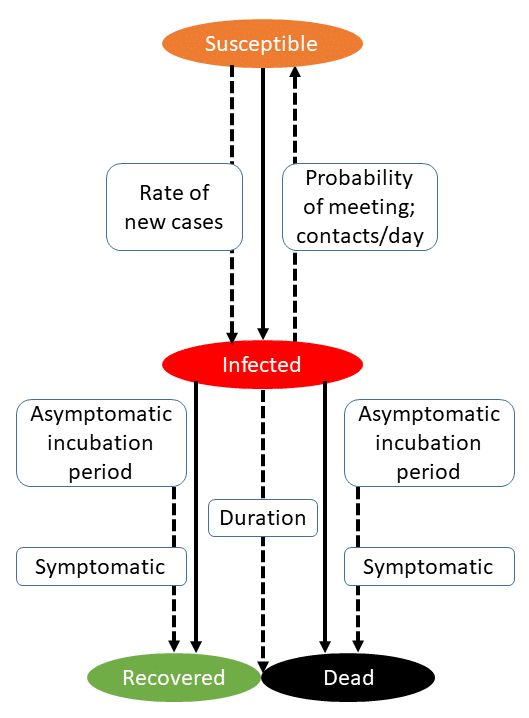
Figure 3. A version of the model described by Kermack & McKendrick (Proc Roy Soc A 1927; 115: 700-21); data can be entered into the model and the different rates at which events occur and the basic or effective reproduction numbers calculated
However, many other methods have been used, including both statistical models and simple calculations. The former range from methods such as the Reed-Frost stochastic model, developed by Lowell J. Reed and Wade Hampton Frost in 1928, similar to a method that was already being developed by H E Soper and which he described in 1929, to the IDEA method, first described by Fisman and colleagues in 2013. Of the methods involving simple mathematical calculation of R0, one that is commonly used involves the following equation: R0 = βS/γ, where β is the transmission rate, S is the number of susceptibles at the start of the epidemic, and γ is the removal rate. There are many other variants of a similar nature.
Figure 4 shows a comparison of estimated values of R0 for a range of viruses, summarized from a variety of published sources. The graph shows how variable estimated values of R0 can be from virus to virus. However, the numbers should be interpreted with caution, since the quality of data on which they were based will have varied from study to study, the data will have been taken at different times during the course of the spread of the virus (e.g. compare influenza in Spring and Autumn 1918), and the models used will have been different. It should also be clear from the graph, although the mortality data are not shown, that R0 is not related to the case fatality rate.
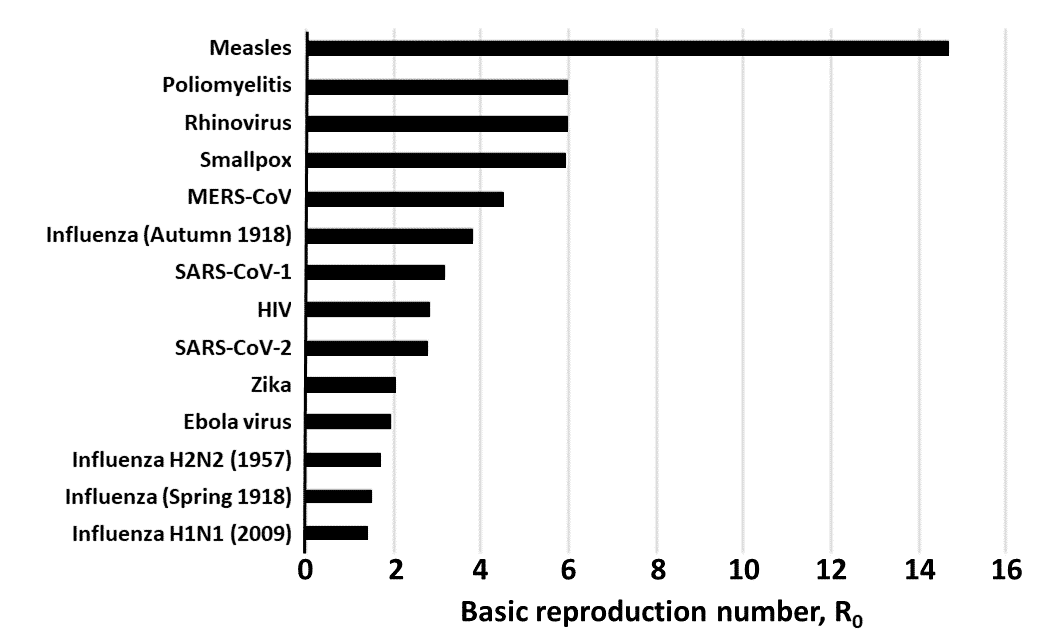
Figure 4. Estimated values of R0 in different viral infections, culled from a variety of published sources
What is the R0 of SARS-CoV-2?
Estimates of the R0 of SARS-CoV-2 vary widely. Figure 5 shows nine estimates, all from studies in China or South Korea. The mean estimate of R0 is 2.63 (95% CI = 1.85,3.41). From a wider survey of 16 published estimates, the mean estimate is 2.65 (1.97, 3.09). In both cases, the range is 0.4-4.6.
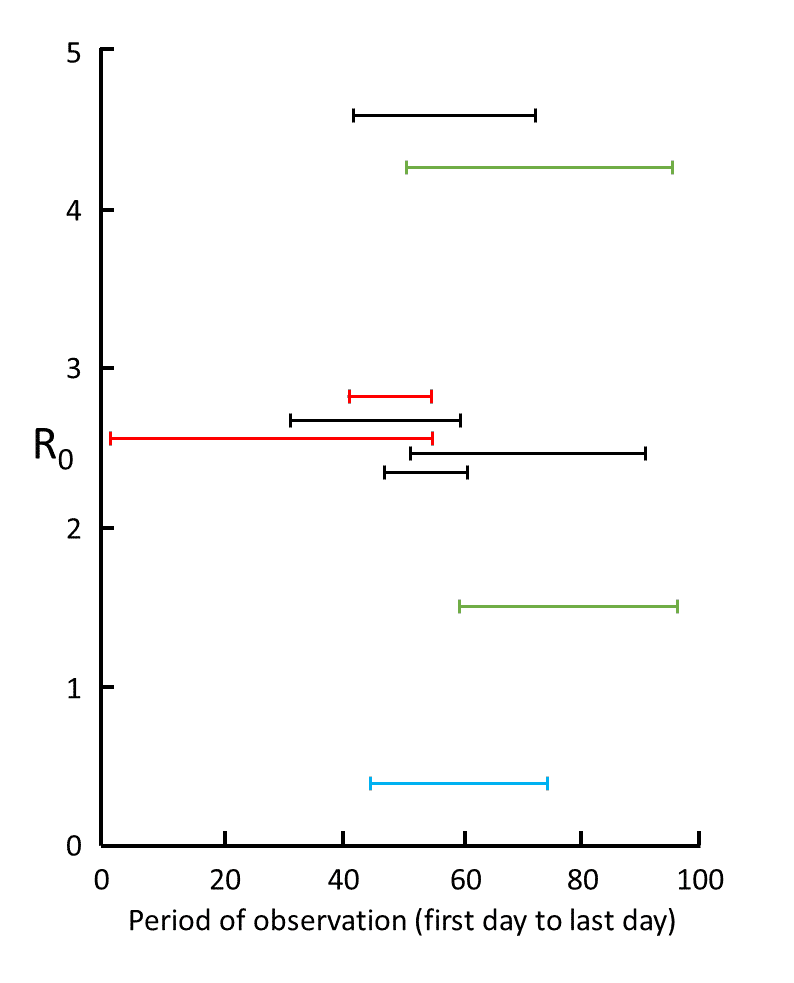
Figure 5. Nine estimates of R0 in studies for which information was given about the time over which the measurements were made, from 1 December (day 1) to 6 March (day 97); the data are from studies in mainland China (red), Wuhan (black), Shenzhen (blue), and South Korea (green); the results show the large degree of variability in mean estimates, attributable to variations in the quality of the data and the models used; however, five of the results cluster around 2.6
This means that in order to protect us against future epidemics, herd immunity of around 62% will be needed, taking the mean estimate across all these studies. Taking the highest value (4.6), 78% immunization will be needed, and it would be wise to aim for at least that. When a test for neutralizing antibodies to SARS-CoV-2 and a vaccine are available, we shall be able to tell to what extent the population has been immunized by exposure and vaccination.
In the UK, one of the key findings that influenced the Government’s decision to start the lockdown was the model presented by the Imperial College COVID-19 response team. The model explores the effect of two strategies (a) suppression, by which interventions are instituted to bring Re to below 1, and (b) mitigation, by which strategies are instituted to reduce the impact of the epidemic, but not interrupt viral transmission completely, thus reducing Re, but not necessarily below 1. The model assumed an R0 of about 2.4 and predicted that, in the absence of any control measures, 81% of the UK population would become infected, with over half a million deaths. However, this number could be reduced to under 50,000 (and possibly under 6000 deaths) with a suite of suppression strategies in place. Little wonder, given these figures, that the UK government swiftly began the lockdown.
It is important to note that the value of R0 varies considerably in the models used in the COVID-19 pandemic. One systematic review reported that the mean of 29 reported values of R0 from 21 studies was estimated at 3.32 (2.81-3.82), with a range of 1.9 to 6.49; all the included studies were from China. In a statement on 23 January, 2020 about the outbreak of COVID-19 the World Health Organization (WHO) gave a preliminary R0 estimate of 1.4–2.5.
Interpreting the news
The Chinese data suggest little change in the reproduction numbers measured at various times over the last 3 months. So when you read a report that the reproduction number (Re) has fallen below 1, which should be cause for rejoicing, be cautious. The calculated value depends on the quality of the data, which may be poor, and the epidemiological model used, which may distort the outcome. Remember George Box’s wise words about models:
“All models are wrong but some models are useful”.
Or as he put it elsewhere, less dramatically but more specifically:
“Models, of course, are never true, but fortunately it is only necessary that they be useful. For this it is usually needful only that they not be grossly wrong”.
Definitions
Some definitions of terms used in this article are given below.
Immunity to a viral infection is the state of being non-susceptible to it, by virtue of being able to produce neutralizing antibodies when challenged by it; such antibodies may be produced by prior exposure or by immunization following vaccination.
Herd immunity is a form of protection from an infectious disease that results when a large enough proportion of the population has become immune, conferring indirect protection from infection on individuals who are not themselves immune.
Vaccination against a viral infection is the administration of a vaccine to an individual with the intention of immunizing that individual or boosting pre-existing immunity.
Immunization against a viral infection is the production of immunity to the infection by virtue of successful vaccination or exposure to the virus.
—————————————————————————————————————————
Disclaimer: the article has not been peer-reviewed; it should not replace individual clinical judgement and the sources cited should be checked. The views expressed in this commentary represent the views of the authors and not necessarily those of the host institution, the NHS, the NIHR, or the Department of Health and Social Care. The views are not a substitute for professional medical advice.

